About evaluating tonality and contrast
Although histogram graphs are good tools for evaluating an image’s exposure, you shouldn’t interpret histograms for exposure information only, because the shape of the histogram is also influenced by the tonality in the scene. You need to take the subject of the image into account when evaluating its histogram. For example, images shot at night naturally have a majority of peaks in the darker side of the histogram.

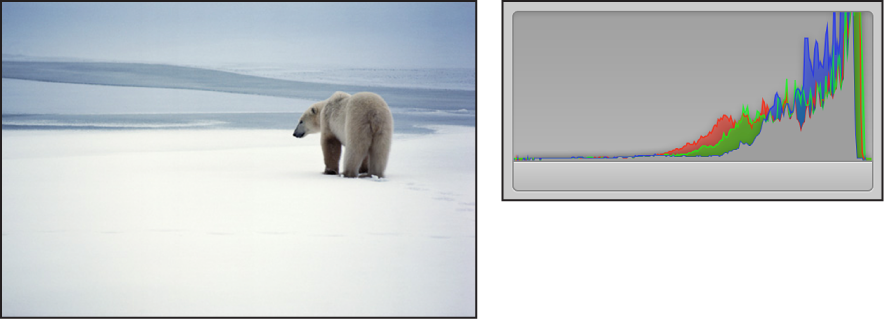
Likewise, images of bright scenes, such as snow or light reflecting off the ocean, have a majority of their peaks in the brighter side of the histogram.
Histograms can also depict contrast in an image. For example, this silhouette of the man in the hammock in front of the sunset consists of a relatively even assortment of extreme bright and dark tonal values with few midtones. In this case, the histogram is shaped like a valley with peaks in both the dark and bright sides.

Likewise, histograms can depict a lack of contrast in an image. For example, an image of a rainbow in the fog lacks contrast. Without directional lighting, there aren’t any highlights or shadows in the image. In this case, the peaks of the histogram are concentrated in the center and don’t come close to either the dark or bright side.
